[This post is a little longer than initially planned – it’s about a 15 minutes read]
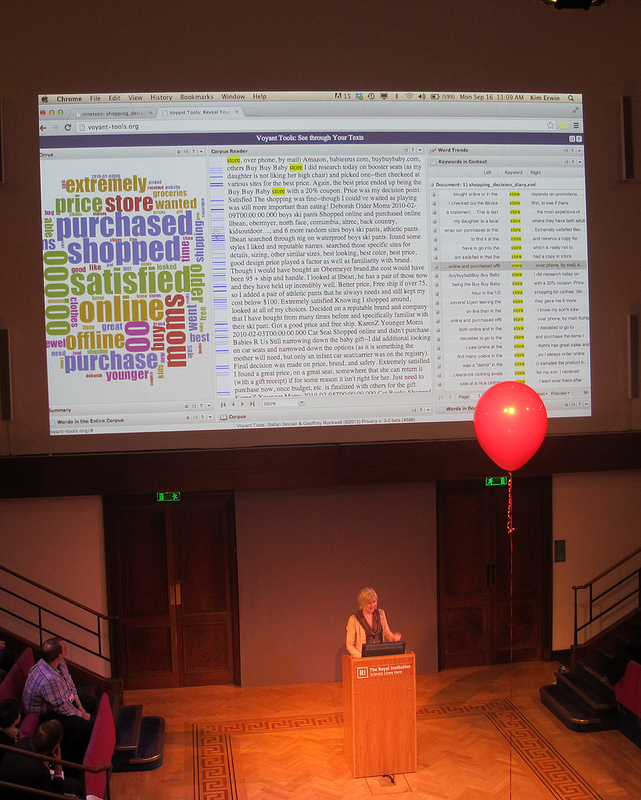
It was of little surprise that big data figured as a major presence at EPIC 2013 in London last week. In a session devoted to the topic, but in other areas of the program (and in the hallway conversations), big data was always lurking. The soundtrack of choice for big data at the conference would be John William’s nerve-jangling music for Jaws. In many ways big data is cast as villain – something to be feared if we find ourselves unable to overcome its awesome power.
This post is meant less as a summary of the discussion. I was, as co-chair, often distracted during the conference so I can’t faithfully record proceedings. Neither is it a defence, god forbid, of my professional community against the apparent ravages of big data. Rather, it’s a think piece based on a recent encounter I’ve had with big data.
What I want to do, by way of engaging with this specific encounters is flag up some areas where we can collectively sharpen up our engagement with this important phenomenon. Specifically, I want to address the following dimensions or issues of big data:
Quantified self vs. Monitored Self — the difference between me assenting to monitor myself vs. being monitored
Asymmetries of exchange — the uneven nature of the exchange between provider and analysyer/reseller of data
Asymmetries of feedback — the importance of balanced feedback systems
Asymmetries of judgment — the difference between the big data creating ‘fact’ and being used to create value judgements
Big data is a big category
The discussion at EPIC 2013 disappointed me a little. It was either constrained by simplistic oppositions (big data good / nothing to fear vs. big data bad / end of our profession as we know it), impoverished by a general lack of ethnographic specificity and illustration, or absented to discuss the power relations that big data entails.
Most worrying for me of all of these was the lack of specificity in the discussion and the absence of discussion about power. Yes, there were some papers that described tools or methodologies that had been created or adopted to make sense of large data sets, and attempts to ground discussion in examples, but for much of the time big data was discussed as if everyone had a shared sense of what the ‘what’ was. I have always felt that the power of our analysis as anthropologists derives from ethnographic detail. That detail allows us move out to broader principles, taxonomies or ideas. It felt much of the time that we were happy to leave things up at a quite a lofty, abstracted level.
Compounding this was an inclination to speak about big data, thick data, raw data, or big ethnographic data. Indeed, one might cheekily observe, the one thing that wasn’t lacking was an ability to put a new set of concepts or language around a now not so old idea.
Many things to many people
It seems to me that beginning with a foundational definition of big data is a good place to start – but very quickly we need to jump into some of the specific types of big data that exist.
Here’s a basic definition from the FT:
Big data is the term used to describe the huge volumes of data generated by traditional business activities and from new sources such as social media. Typical big data includes information from store point-of-sale terminals, bank ATMs, Facebook posts and YouTube videos.
That’s a start but as I’ve argued, I think working through the specifics of a big data based service is the best means of getting at the issues. When I’ve explored an example, I’ll work through some of the issues I think are ripe for further discussion and possible intervention.
The Case of the “Driving Style User Interface”
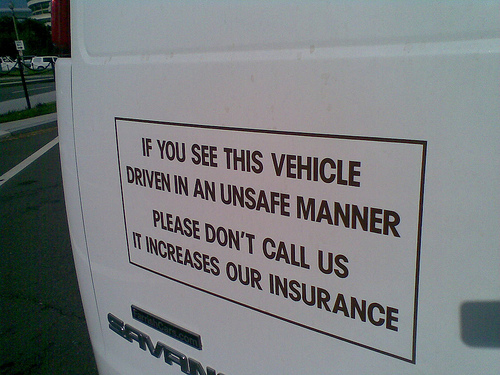
I live in south London. From a crime perspective I don’t have a great postcode. (In fact, I got burgled the night before EPIC). This makes insurance expensive. I recently had to put our 20-year-old au pair on the car insurance. The first quotes I got through were in the £5,000 range (for a car with a value of £3,500). Eventually I found a more reasonable quote, which was reduced substantially when I consented to having a tracking device fitted to the vehicle.
I was told that the information that this device collected would not be used to either increase or decrease the premium this year. However, it would be used in providing a quote in the following year. The call centre operative was not able to give me much detail about the device except that in addition to tracking speed, it would use sensors to monitor accelerating and cornering (“and stuff like that”).
Looking down the barrel of a very large insurance premium I duly agreed to have our au pair, my wife and my own driving tracked and analyzed. My immediate thoughts about this were:
If this is a technology designed to understand better the driving habits of young people the service has no way of knowing when the au pair is driving.
Given the au pair is from rural Sweden, has never driven on London roads or a right hand drive car, she’s pretty likely to drive fairly gingerly down south London streets barely wide enough for two small cars. In a rural context, with fast roads, dangerous bends and pubs miles from home this system may make more sense. But in London….?
I’d better slow down. This is more likely to end in trouble based on my driving than hers. This technology is more likely to discipline my wife and I than the au pair. We have over 20 years of driving nonchalance in our systems.
The charming man who subsequently fitted the kit behind the dashboard – there no visible reminders that this system is collecting and sharing information about you – told me, cheerfully, that “Big Brother was now watching”. I’ve taken that to heart and feel a watchful but invisible eye looking over me as a do a school run. The difference between a 20 and 30 mile an hour zone now seems truly significant.
But two weeks later let’s see what Big Brother understands…and what I feel about this specific instantiation of big data, in the form of a telematics system.
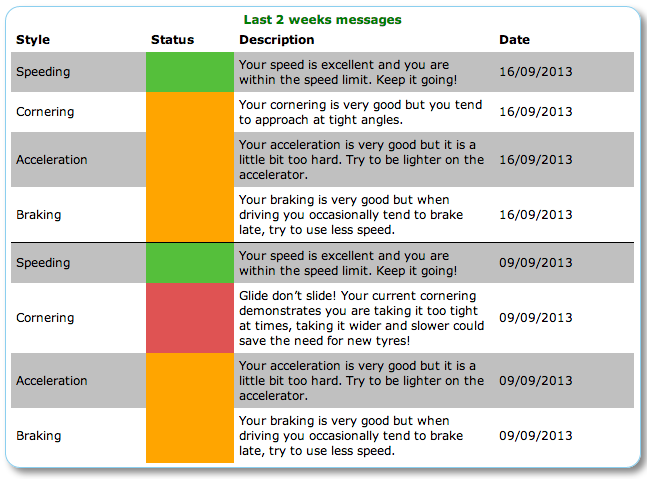
How’s my (our) driving?
I logged in last night to the Driving Style UI to see how we’re doing. There is good news. We’re “’good’ drivers”. That the system is modest enough to put ‘good’ in quote marks bears witness to the tricky interpretive art of judging driving behavior or skills – an area of life where people are famously self-delusional about their level of mastery, especially compared to others.
However, beyond the broad judgment, we also now get ‘helpful’ guidance on speeding, cornering, braking and acceleration.
My response to all of this is, much the same as many other big data led services is ambiguous – and given the algorithms currently consider the three drivers of this particular car ‘good’ I guess I’m feeling more charitable than I might if the judgment were harsher.
The ambiguity of our responses to big data led services is where, I believe, we should pay attention as researchers , designers and business advisors. There are several dimensions to my response that I want to reflect on, most of which pivot around the notion of asymmetry.
Quantified self vs. Monitored Self
On my recently stolen iPhone sat a number big data driven App that I had chosen to use: Runkeeper and Moves seem relevant to this discussion. Moves, like my new telematics system, sits unobtrusively in the background, monitoring my location and speed to tell me how far I’ve walked, cycled and run and how many calories I’ve burned. I like Moves. I signed up for it despite having no idea who is behind the service and where the data goes.
The same is true of Runkeeper. Despite the naivety of this I have at least made a choice about this for myself. Of course, I similarly opted to have the telematics device fitted but the dice are slightly loaded there. Submitting to a regime of driving surveillance saves me money. Volunteering to track myself and share this with a Quantified Self algorithm helps me understand my everyday health behaviours. It doesn’t make me richer or poorer, but it might make me healthier. What’s in it for the App developer though still isn’t clear!
In my view we should note (and debate) a common sense distinction between surveillance, and quantified self, even if the line between them can get fuzzy.
Asymmetries of exchange
The canonical big data service in Britain was, arguably, the Tesco club card, creation of husband and wife team Dunn (and) Humby for the big grocery retailer. It used shopping behavior, along with other socio-demographics to build a picture of customers that was used for strategic product planning, pricing and promotion activity and delivered something to customers in return for sharing their data – vouchers (for products they either used or Tesco thought they might be interested in using). You might have your problems with that exchange – data for vouchers – but it’s a reasonably open and honest one.
However, as the digerati are prone to tell us about the 1000s of free products that are supported by data-driven advertising, “if the product is free, you are the product”. There’s truth in this neologism but the nature of that exchange between the provider of a free services and its users is often unclear: what value do my data have, who pays for those data (advertisers, retailers, media buyers, credit scoring companies?), what do the buyers of those data do with these resources?
When my data start to live in a complex value chain that is neither visible nor explicable, there is a clear and obvious asymmetry of exchange that makes even rentier capitalists look like straight up, honest, businessmen. It feels a little like going to a market to shop for groceries with a blindfold on – hardly the basis for a fair market transaction.
Asymmetries of feedback: One striking feature of the feedback I get from the telematic service I’ve just enrolled in is how little and how static that feedback is. I need to log on to the site to get any information – which is updated on a weekly basis. No information design here to send nudges, reminders, warnings or even reprimands. No Smartphone App. No weekly email. There is a feedback loop but it is a somewhat closed one. That absence of continual or accessible feedback creates, in my mind at least, the idea that this is not a system for me to engage with, but one I can choose to visit should I want to. The absence of system-side feedback positions this as a service provided for the benefit of others, but not the drivers.
Asymmetries of judgment: One of the reasons that I willingly submitted to capture and share information about my lifestyle is that I get something in return. With Moves it’s a daily summary of my exertions, simply presented. With Runkeeper it’s a longer term picture of my running, routes, and reminders to go running. I don’t know what processes and algorithms deliver this experience to me but despite my ignorance of what happens inside the black box I’m content with the exchange because it feels useful to me and it’s not making judgments. Instead it gives me raw data or facts.
The case of the telematics is rather different, as my telematics ‘service’ announced:
Please be aware that in order to determine your speed relative to your location we use the GPS technology in the unit and road speed limit data we receive from an external supplier. We do recognise that there may be some discrepancy between the data we receive and the sign posted speed limit of certain roads and because of this, we use a total score. This incorporates all aspects of your driving style, such as acceleration, braking, cornering, into account, rather than individual events, to determine how ‘good’ a driver you are.
Unfortunately, we are unable to enter into individual conversations about your driving style events and scores.
Not only is the system making judgments about our driving – judgments that will change the nature of the commercial relationship I have with my insurer, but they are effectively closing down the conversation about those judgments: as a user I know nothing of the technology, the algorithms and how ‘they’ (who is the ‘they’?) make judgments about driving skill. Further, I know they are not open to discussing these judgements but that they will make decisions based on them. That’s a very different and asymmetric conversation based on big data.
It seems to me that this asymmetry is one of the most obvious and popularly unsettling features of the uneven power relations involved in big data. Credit scoring agencies like Experian have been at this for years – they munge together lots of different information about you and make a value judgment. And they charge you to see under the hood and get a proper report.
But the case of the credit scoring companies of old is somewhat simpler than current developments where ‘scoring as a service’ companies such as Kreditech looks at 8,000 indicators, such as “location data (GPS, micro-geographical), social graph (likes, friends, locations, posts), behavioral analytics (movement and duration on the webpage), people’s e-commerce shopping behavior and device data (apps installed, operating systems)” in order to make financial judgments. How can individual consumers enter into meaningful conversations about how those judgments are made, let alone how those data is sourced and sold back into the data economy, when the marketplace for those data is so large, complex and recursive.
Engaging with the business of big data

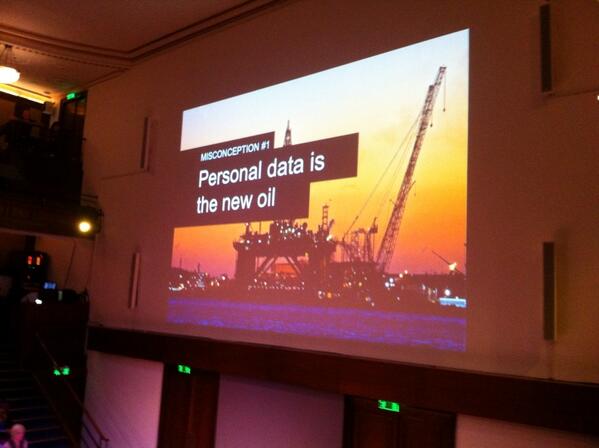
King Canute had a hard time keeping the sea at bay. Attempting to hold back the deluge of big data, and criticize businesses that either improve, adapt or defend their business through big data or, indeed, find ways of monetizing it, is surely a pointless exercise and that is certainly not my intention. However, what the ‘data as the new oil’ slogan ignores is that the data seam now being discovered is both quite unlike oil in that it is infinite and very much like it because data, like oil, is inherently political (See Tim Mitchell’s work on Carbon Democracy). Data is contested and contestable, and deeply woven into political-economic structures, regimes and conflicts.
It seems to me that there are range of issues at stake here that the ethnographer-anthropologist-designer-technologist complex should engage with. Primarily, I would like to see issues of power relations and asymmetries in knowledge about and access to big data addressed central in our work not because they are political per se but because I think these issues present risks and challenges we should inform others about, and opportunities we should help others seize.
1.Incentive structures: The financial crisis didn’t come about through an absence of money – there was plenty of it knocking around – but because of the absence of trust. Banks and financial institutions hoarded their money because they didn’t trust each other. Economies need money to flow, for credit to be extended. It seems to me that big data is taking the form of credit crunch style hoarded money. It looks less and less like an exchanged and exchangeable entity and more like one to hoard in data centres. So for me one question for business is how do you not only get, analyze and use big data, but how do you ensure that there is a meaningful flow of the data you gather and use between yourselves and your customers. It may have some critics but Dunn Humby’s revolutionary work for Tesco, and the Nectar card seem to answer this quest of incentive in a simple but effective way. What other emergent models from the world of Quantified Self or elsewhere can ensure that there is at least a semblance of balance, and thus of trust and engagement, between those who harvest and those who produce the big data?
2. Interaction design: Closely connected with this question on incentive is the issue of feedback. As I’ve suggested, services which have a tendency towards an asymmetry of feedback –telematics services that refuse to enter into conversation about their judgments of your driving skills or systems that are configured to provide infrequent or inconsistent feedback based on your data are missing a trick. Striving to a more symmetric data sharing and feedback relationship strikes me as the most fundamental of design principles within a user-centred application of big data. Allow me to see the data in formats that uses design to communicate, allow me to understand how this and other data is complied and analyzed and let me into the conversation about how this drives decision making or other outputs. That’s my wish list. Wishful thinking perhaps but ignoring that creates business risks. Taking this challenge on is an enormous opportunity for business pulling in and sitting on stockpiles of data.
3. Big data and business risks: As BP and Exxon found out a major (oil) leak creates reputational (and environmental) damage that lasts decades. I’m not predicting a data leak of enormous proportions nor am I in the game of predicting the nature of a Black Swan – that would run counter to the Black Swan theory – but it strikes me that another NSA / Snowden type affair could shift public perceptions and behaviours. Companies who collect, use and share data in asymmetric ways, seem to me at risk of disruption or fall out (reputational or otherwise) from such behavior or perception shifts and those risks are greatest when there are clear asymmetries in the way they collect, share and feedback data. (Note to self: there’s a whole other essay to be written about the different cultural, commercial and legal regimes of data ownership).